StreamingQueryStatisticsPage
StreamingQueryStatisticsPage is a WebUIPage (Spark Core) that renders a page with the following sections as Streaming Query Statistics:
StreamingQueryStatisticsPage is available under statistics URL prefix.
StreamingQueryStatisticsPage uses id request parameter as the runId of a streaming query to render a page of.
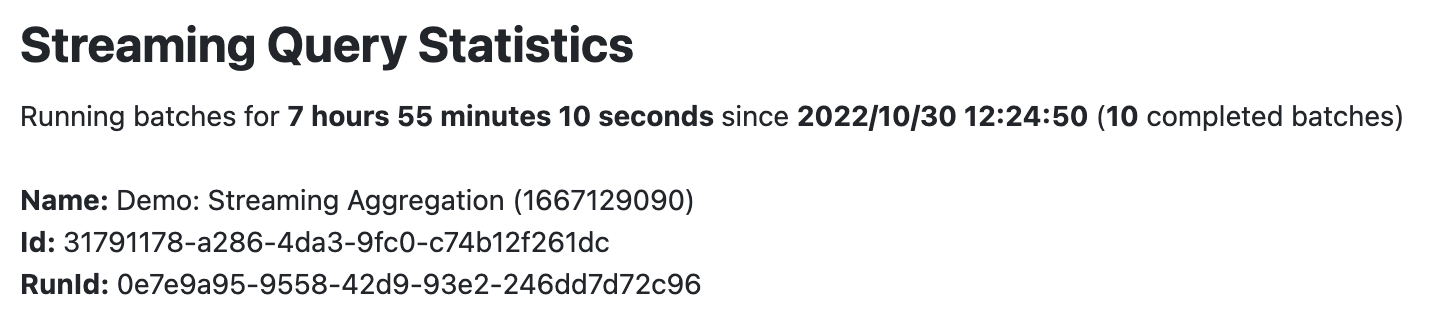
Demo: Streaming Aggregation
Use Demo: Streaming Aggregation to learn more and monitor the statistics.
Creating Instance
StreamingQueryStatisticsPage takes the following to be created:
- Parent StreamingQueryTab
StreamingQueryStatisticsPage is created when:
StreamingQueryTabis created (and attaches this and StreamingQueryPage pages)
Timelines and Histograms
Displayed only when there are stateful operators in a streaming query.
Aggregated Number Of Rows Dropped By Watermark
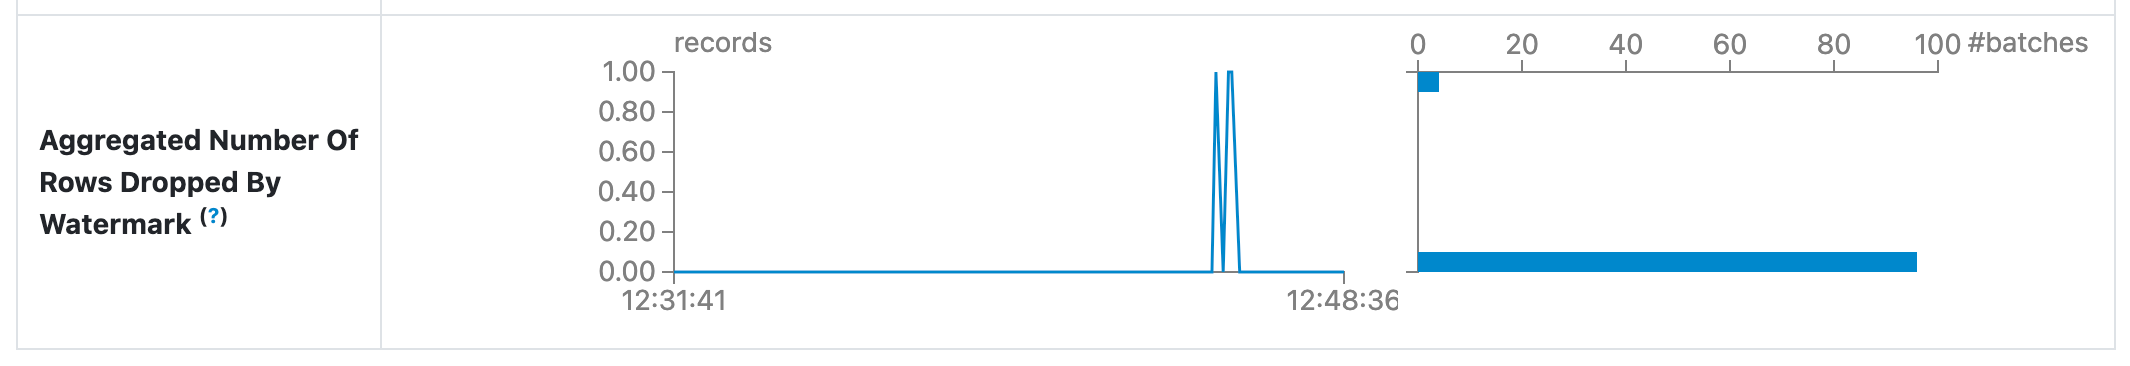
Number of all input rows in stateful operators that were late and hence dropped by watermark
Sum of numRowsDroppedByWatermark metrics of stateOperators of every StreamingQueryProgress
StreamingQueryStatisticsPage uses generateAggregatedStateOperators to generate a timeline and a histogram for aggregated-num-rows-dropped-by-watermark-timeline and aggregated-num-rows-dropped-by-watermark-histogram HTML divs, respectively.
Aggregated Number Of Total State Rows
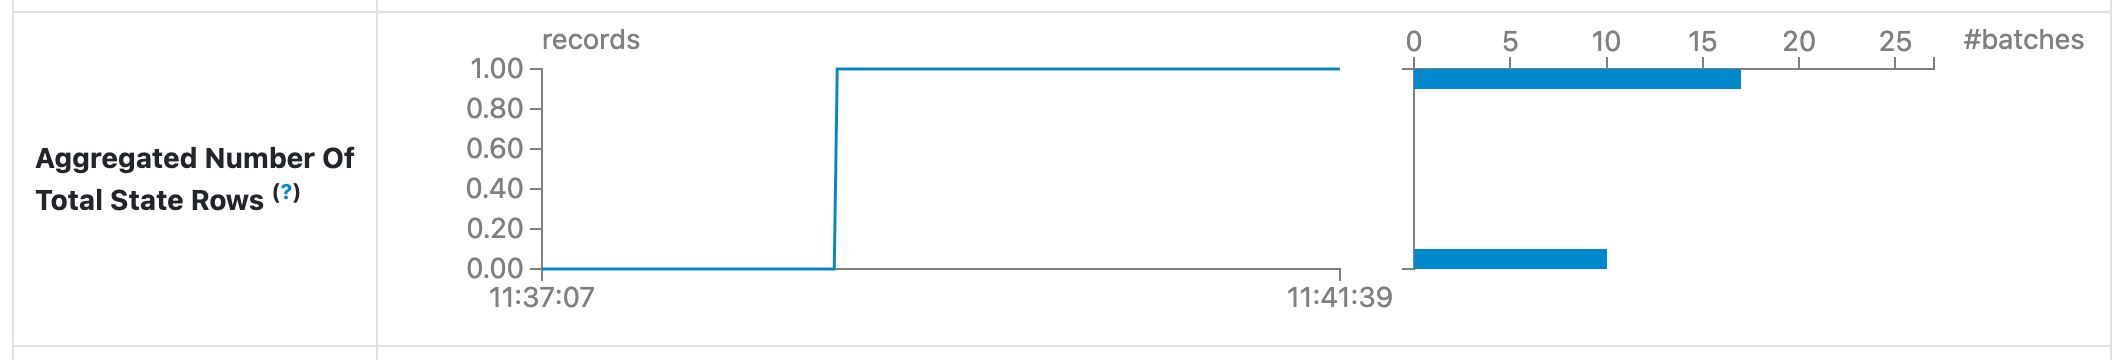
The number of state rows across all stateful operators
Total (sum) of numRowsTotal metrics of stateOperators of every StreamingQueryProgress
StreamingQueryStatisticsPage uses generateAggregatedStateOperators to generate a timeline and a histogram for aggregated-num-total-state-rows-timeline and aggregated-num-total-state-rows-histogram HTML divs, respectively.
Aggregated Number Of Updated State Rows
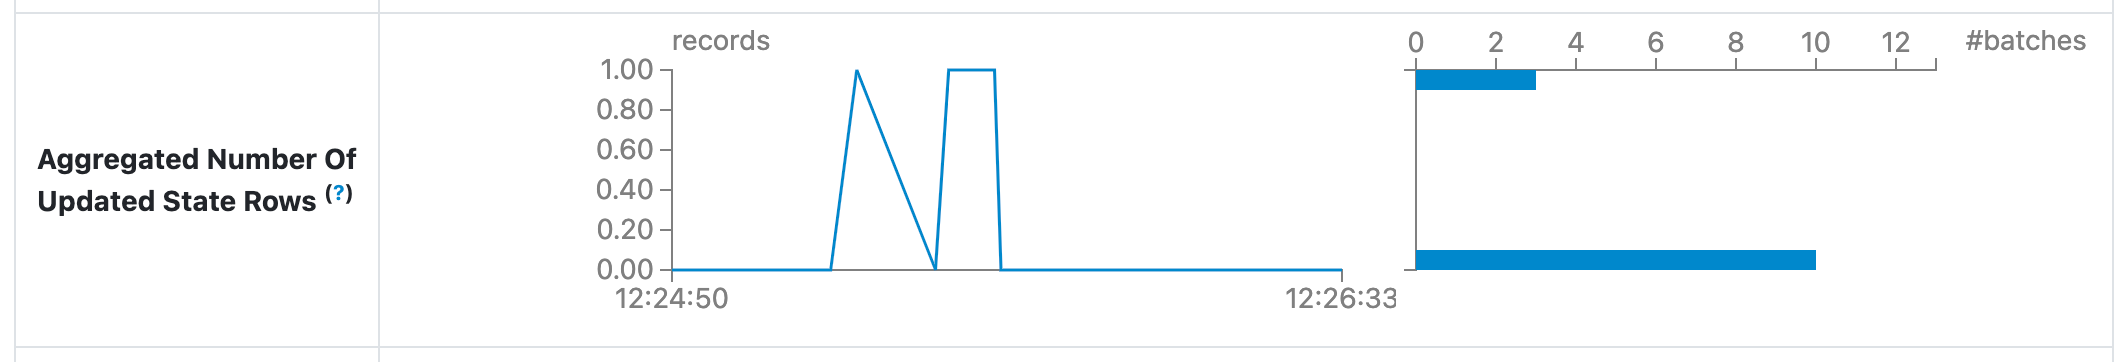
Total (a sum in records unit) of numRowsUpdated metric of stateOperators of every StreamingQueryProgress
- The X axis is from
minBatchTimetomaxBatchTime - The Y axis is from 0 to
maxNumRowsUpdated
StreamingQueryStatisticsPage uses generateAggregatedStateOperators (graphUIDataForNumberUpdatedRows) to generate a timeline and a histogram for aggregated-num-updated-state-rows-timeline and aggregated-num-updated-state-rows-histogram HTML divs, respectively.
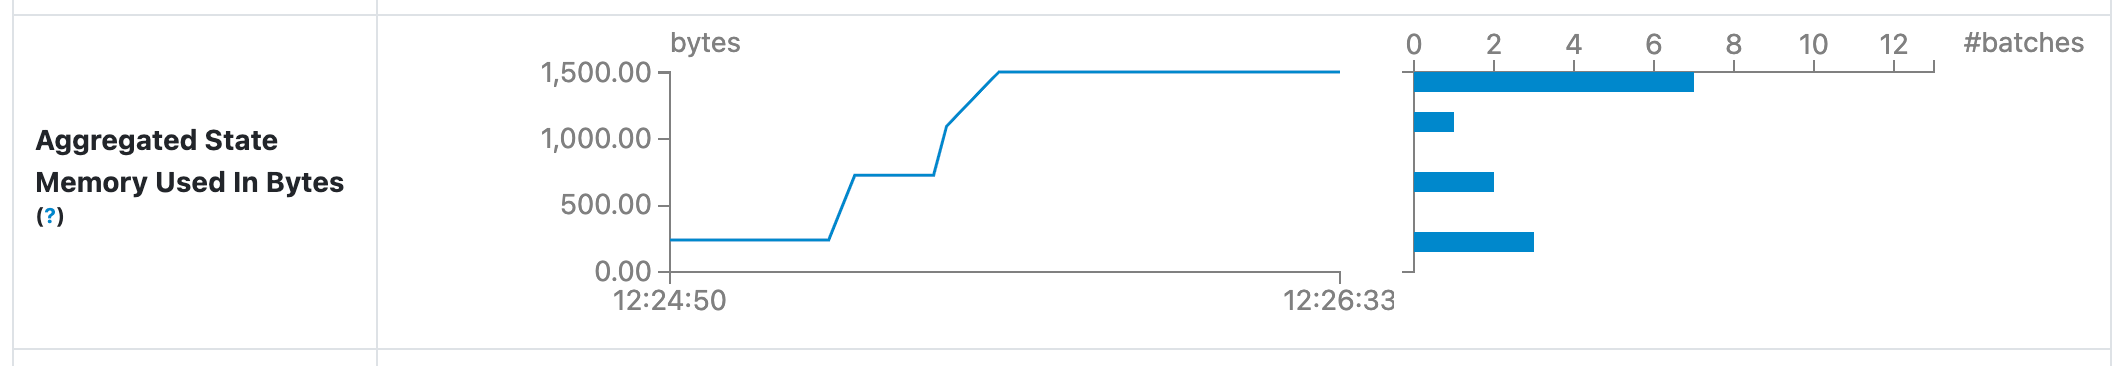
Aggregated State Memory Used In Bytes
Global Watermark Gap
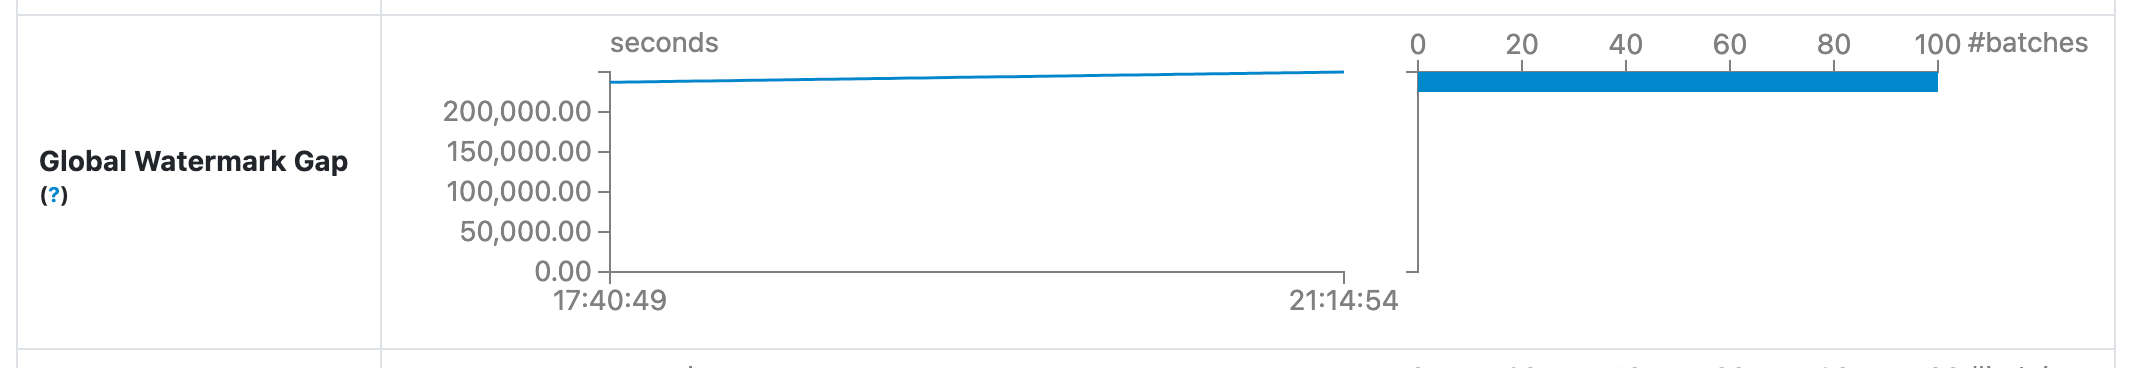
A time series of the gaps (differences) between the batch timestamp and the global watermark (in secs).
Only displayed when there is a global watermark in a streaming query.
Global Watermark of Batch
Global Watermark of a batch is the value of the watermark entry in the Event Time Statistics of a StreamingQueryProgress.
watermark entry will only be included in the Event Time Statistics for a streaming query with EventTimeWatermark logical operator.
StreamingQueryStatisticsPage uses generateWatermark to generate a timeline and a histogram for watermark-gap-timeline and watermark-gap-histogram HTML divs, respectively.
Rendering Page
render(
  request: HttpServletRequest): Seq[Node]
render is part of the WebUIPage (Spark Core) abstraction.
render uses the id request parameter for the runId of the streaming query to render statistics of.
render requests the parent StreamingQueryTab for the StreamingQueryStatusStore for the allQueryUIData to find the data of the streaming query (by runId).
render generates a HTML page with the following sections:
Generating Basic Info
generateBasicInfo(
  uiData: StreamingQueryUIData): Seq[Node]
generateBasicInfo...FIXME
Generating Statistics Table
generateStatTable(
  query: StreamingQueryUIData): Seq[Node]
generateStatTable renders the timelines and histograms of the following:
- Input Rate
- Process Rate
- Input Rows
- Batch Duration
- Operation Duration
- Global Watermark Gap
- generateAggregatedStateOperators
Generating Global Watermark Gap
generateWatermark(
  query: StreamingQueryUIData,
  minBatchTime: Long,
  maxBatchTime: Long,
  jsCollector: JsCollector): Seq[Node]
generateWatermark finds the global watermark (watermark entry in the eventTime) of the last StreamingQueryProgress of a streaming query.
Unless found, generateWatermark returns nothing (an empty collection).
generateWatermark scans StreamingQueryProgresses for which the global watermark is greater than 0 and collects a time series (data points) with the following:
- Batch timestamp
- The gap (difference) between the batch timestamp and the global watermark (in secs)
generateWatermark creates a GraphUIData to generate a timeline and a histogram for watermark-gap-timeline and watermark-gap-histogram HTML divs, respectively.
generateAggregatedStateOperators
generateAggregatedStateOperators(
  query: StreamingQueryUIData,
  minBatchTime: Long,
  maxBatchTime: Long,
  jsCollector: JsCollector): NodeBuffer
generateAggregatedStateOperators takes stateOperators of the last StreamingQueryProgress of the given streaming query (as StreamingQueryUIData).
Unless available, generateAggregatedStateOperators returns nothing (an empty collection).
generateAggregatedStateOperators generates data points for a timeline and a histogram for aggregated-num-total-state-rows as the sum of numRowsTotal metrics of stateOperators.
generateAggregatedStateOperators...FIXME
In the end, generateAggregatedStateOperators generateAggregatedCustomMetrics based on spark.sql.streaming.ui.enabledCustomMetricList.
generateAggregatedCustomMetrics
generateAggregatedCustomMetrics(
  query: StreamingQueryUIData,
  minBatchTime: Long,
  maxBatchTime: Long,
  jsCollector: JsCollector): NodeBuffer
generateAggregatedCustomMetrics takes the names of the custom metrics from the (head) StateOperatorProgress of the latest StreamingQueryProgress.
For every custom metric that is included in spark.sql.streaming.ui.enabledCustomMetricList, generateAggregatedCustomMetrics...FIXME
Enabled Custom Metric
StreamingQueryStatisticsPage uses spark.sql.streaming.ui.enabledCustomMetricList configuration property for the names of the Supported Custom Metrics to generateAggregatedCustomMetrics (in addition to generateAggregatedStateOperators).
StreamingQueryStatisticsPage prints out the following DEBUG message to the logs with the custom metrics when created:
Enabled custom metrics: [enabledCustomMetrics]
Supported Custom Metrics
StreamingQueryStatisticsPage requests the system StateStoreProvider (based on spark.sql.streaming.stateStore.providerClass configuration property) for the supported custom metrics when created.
Only supported custom metrics can be enabled to be displayed in the web UI.
StreamingQueryStatisticsPage prints out the following DEBUG message to the logs with the supported custom metrics when created:
Supported custom metrics: [supportedCustomMetrics]
Logging
Enable ALL logging level for org.apache.spark.sql.streaming.ui.StreamingQueryStatisticsPage logger to see what happens inside.
Add the following line to conf/log4j.properties:
log4j.logger.org.apache.spark.sql.streaming.ui.StreamingQueryStatisticsPage=ALL
Refer to Logging.