Spark Metrics
Spark Metrics gives you execution metrics of Spark subsystems (metrics instances, e.g. the driver of a Spark application or the master of a Spark Standalone cluster).
Spark Metrics uses Dropwizard Metrics Java library for the metrics infrastructure.
Metrics is a Java library which gives you unparalleled insight into what your code does in production.
Metrics provides a powerful toolkit of ways to measure the behavior of critical components in your production environment.
Metrics Systems
applicationMaster
Registered when ApplicationMaster (Hadoop YARN) is requested to createAllocator
applications
Registered when Master (Spark Standalone) is created
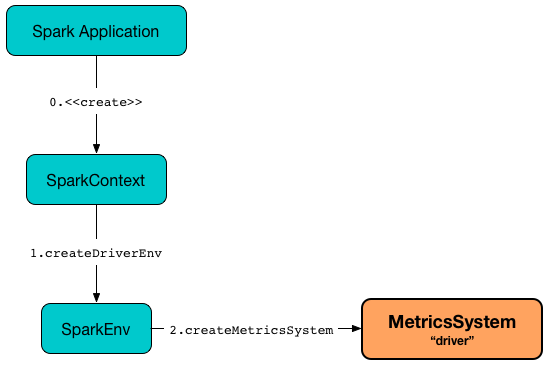
driver
Registered when SparkEnv is created for the driver
executor
Registered when SparkEnv is created for an executor
master
Registered when Master (Spark Standalone) is created
mesos_cluster
Registered when MesosClusterScheduler (Apache Mesos) is created
shuffleService
Registered when ExternalShuffleService is created
worker
Registered when Worker (Spark Standalone) is created
MetricsSystem
Spark Metrics uses MetricsSystem.
MetricsSystem uses Dropwizard Metrics' MetricRegistry that acts as the integration point between Spark and the metrics library.
A Spark subsystem can access the MetricsSystem through the SparkEnv.metricsSystem property.
MetricsConfig
MetricsConfig is the configuration of the MetricsSystem (i.e. metrics spark-metrics-Source.md[sources] and spark-metrics-Sink.md[sinks]).
metrics.properties is the default metrics configuration file. It is configured using spark-metrics-properties.md#spark.metrics.conf[spark.metrics.conf] configuration property. The file is first loaded from the path directly before using Spark's CLASSPATH.
MetricsConfig also accepts a metrics configuration using spark.metrics.conf.-prefixed configuration properties.
Spark comes with conf/metrics.properties.template file that is a template of metrics configuration.
MetricsServlet Metrics Sink
Among the metrics sinks is spark-metrics-MetricsServlet.md[MetricsServlet] that is used when sink.servlet metrics sink is configured in spark-metrics-MetricsConfig.md[metrics configuration].
CAUTION: FIXME Describe configuration files and properties
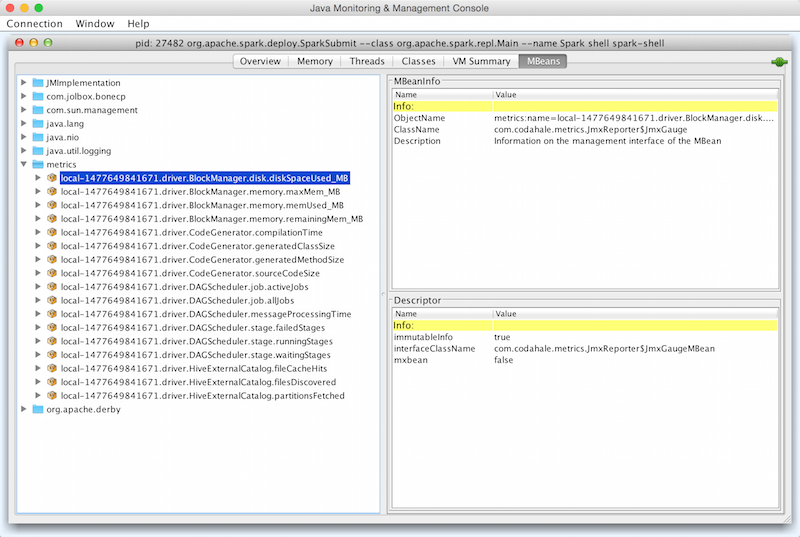
JmxSink Metrics Sink
Enable org.apache.spark.metrics.sink.JmxSink in spark-metrics-MetricsConfig.md[metrics configuration].
You can then use jconsole to access Spark metrics through JMX.
JSON URI Path
Metrics System is available at http://localhost:4040/metrics/json (for the default setup of a Spark application).
$ http --follow http://localhost:4040/metrics/json
HTTP/1.1 200 OK
Cache-Control: no-cache, no-store, must-revalidate
Content-Length: 2200
Content-Type: text/json;charset=utf-8
Date: Sat, 25 Feb 2017 14:14:16 GMT
Server: Jetty(9.2.z-SNAPSHOT)
X-Frame-Options: SAMEORIGIN

{
    "counters": {
        "app-20170225151406-0000.driver.HiveExternalCatalog.fileCacheHits": {
            "count": 0
        },
        "app-20170225151406-0000.driver.HiveExternalCatalog.filesDiscovered": {
            "count": 0
        },
        "app-20170225151406-0000.driver.HiveExternalCatalog.hiveClientCalls": {
            "count": 2
        },
        "app-20170225151406-0000.driver.HiveExternalCatalog.parallelListingJobCount": {
            "count": 0
        },
        "app-20170225151406-0000.driver.HiveExternalCatalog.partitionsFetched": {
            "count": 0
        }
    },
    "gauges": {
    ...
    "timers": {
        "app-20170225151406-0000.driver.DAGScheduler.messageProcessingTime": {
            "count": 0,
            "duration_units": "milliseconds",
            "m15_rate": 0.0,
            "m1_rate": 0.0,
            "m5_rate": 0.0,
            "max": 0.0,
            "mean": 0.0,
            "mean_rate": 0.0,
            "min": 0.0,
            "p50": 0.0,
            "p75": 0.0,
            "p95": 0.0,
            "p98": 0.0,
            "p99": 0.0,
            "p999": 0.0,
            "rate_units": "calls/second",
            "stddev": 0.0
        }
    },
    "version": "3.0.0"
}
NOTE: You can access a Spark subsystem's MetricsSystem using its corresponding "leading" port, e.g. 4040 for the driver, 8080 for Spark Standalone's master and applications.
NOTE: You have to use the trailing slash (/) to have the output.
Spark Standalone Master
$ http http://192.168.1.4:8080/metrics/master/json/path
HTTP/1.1 200 OK
Cache-Control: no-cache, no-store, must-revalidate
Content-Length: 207
Content-Type: text/json;charset=UTF-8
Server: Jetty(8.y.z-SNAPSHOT)
X-Frame-Options: SAMEORIGIN

{
    "counters": {},
    "gauges": {
        "master.aliveWorkers": {
            "value": 0
        },
        "master.apps": {
            "value": 0
        },
        "master.waitingApps": {
            "value": 0
        },
        "master.workers": {
            "value": 0
        }
    },
    "histograms": {},
    "meters": {},
    "timers": {},
    "version": "3.0.0"
}